
Back to list
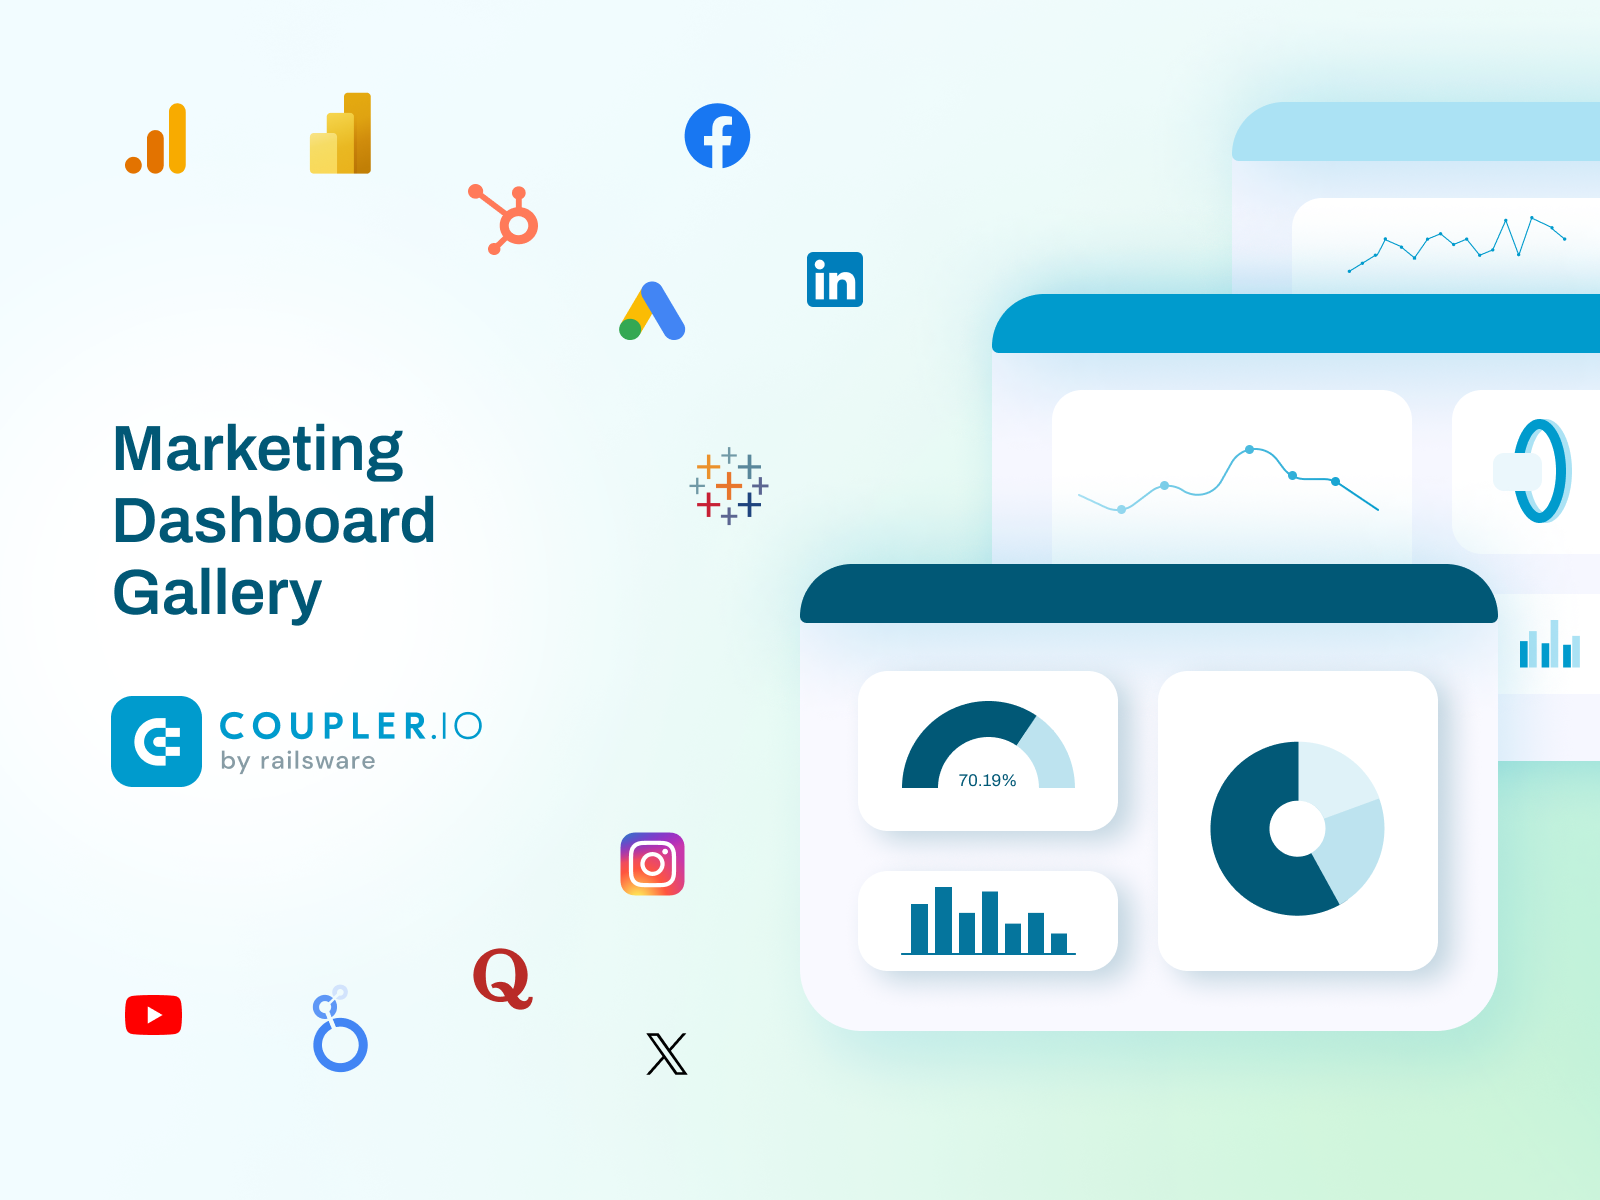
Marketing Dashboard Gallery by Coupler.io
About
Many marketers encounter reporting problems that affect marketing performance evaluation and business growth. So, the Coupler.io team introduced the free dashboard gallery to help companies succeed in marketing analytics.
Client
Submited by
Realization period
Technologies
Team
Services
case study
Marketing Dashboard Gallery by Coupler.io
Background: From exporting data to beautiful reports
Coupler.io was born in 2020 as a data integration solution. Users could automatically extract data from various software and import it to spreadsheets or databases. The product started based on our inner-company needs and went public. We understood that even though businesses are different, many struggle with data management, which is critical.
Providing data integration services, we realized that people still need assistance getting a true sense of their data – gaining insights and catching crucial details. That's why we shifted our focus to helping organizations simplify their reporting efforts, allowing them to measure business performance in real time and make data-driven decisions.
In 2023, Coupler.io evolved into a no-code reporting and automation solution. Notably, the project Marketing Dashboard Gallery began empowering businesses with a convenient way to always have visually appealing and fresh data.
Challenges: Marketers face the same reporting problems
A modern business uses 130 apps on average. Digital marketing strategies also rely on many channels and services in parallel. This leads to a bigger volume of data for processing. However, 74% of companies don't use their data at total capacity, having difficulties evaluating if their strategies perform well.
A few marketing reporting problems that encouraged us to start the dashboard template project:
- Tons of data are located in different places — in CRMs, ad platforms, social media, websites, etc. But, marketers need to evaluate marketing data fully.
- Exporting and combining data. Businesses need to analyze not only marketing data. Sales, finances, and project records are also insightful, while combining and clearly showcasing those records can be a resource-consuming task.
- Real-time data is a must now. Getting fresh data using a manual approach can be either messy, time-draining, or both. Automation can solve this problem.
- Reports from scratch. What if a marketer needs to learn how to compile a report from scratch? Templates with pre-defined benchmarks and customization allow specialists to save time with reporting.
In brief, businesses need to unravel complex data through automation and visualization to assess their marketing performance. This also saves resources and improves accuracy. Our marketing team, thousands of customers, and fellow marketers worldwide have proven this.
Highlights: Simplifying approaches to marketing analytics
We've started crafting the first dashboard templates based on the reporting challenges our team and other marketers faced. Strategic sessions, CusDev interviews, and our research on data-driven marketing strategy showed us the development path. The synergy between the product, dev, and marketing teams made it possible to successfully move the project forward.
We realized that Coupler.io (as a product) needs more data sources, destinations, and data transformation options. We implemented it. Eventually, Coupler.io became an automation and analytics platform. It can export data from over 60 apps, join and transform it, and visualize it in popular BI tools like Looker Studio, Power BI, Tableau, and more.
The first public templates appeared in mid-2023, and people started actively using them. Our design and analytics teams ensured UI consistency to make each dashboard aesthetically pleasing and informative. While continuously polishing templates, creating new ones, implementing customer feedback, and improving product features have boosted this project further.
In the summer of 2024, the key milestones of the Marketing Dashboard Gallery by Coupler.io include:
- 60 predefined dashboard templates are available (the number is constantly growing)
- All templates are free to use and easy to set up
- We've covered most marketing reporting use cases, e.g., for PPC, social media, SEO, marketing strategy, and more.
- We provide multi-channel dashboard templates
- We allow making our templates white-label and customize the way users need
- Apart from templates for marketers, we offer pre-built dashboards for sales, financial, ecommerce, and other data.
Thousands of users create reports with Coupler.io and our dashboard gallery. We also share tutorials, guides, videos, and other materials to assist businesses with vast reporting and analysis cases. This correlates with one of our commitments: contributing to the worldwide digital marketing community and helping companies to grow using their data efficiently.
To know more and try Coupler.io's dashboard templates, you can visit: https://www.coupler.io/dashboard-examples